Plant Physiology 138: 1538-1551 (2005)
Water Uptake and Distribution in Germinating Tobacco Seeds Investigated in Vivo by Nuclear Magnetic Resonance Imaging [w]
Institut für Biologie II (Botanik/Pflanzenphysiologie), Albert-Ludwigs-Universität Freiburg, Schänzlestr. 1, D-79104 Freiburg i. Br., Germany, Web: 'The Seed Biology Place' http://www.seedbiology.de (K.M., B.K., G.L.-M.)
Received February 21, 2005; revised April 14, 2005; accepted Aprill 20, 2005; published June 24, 2005
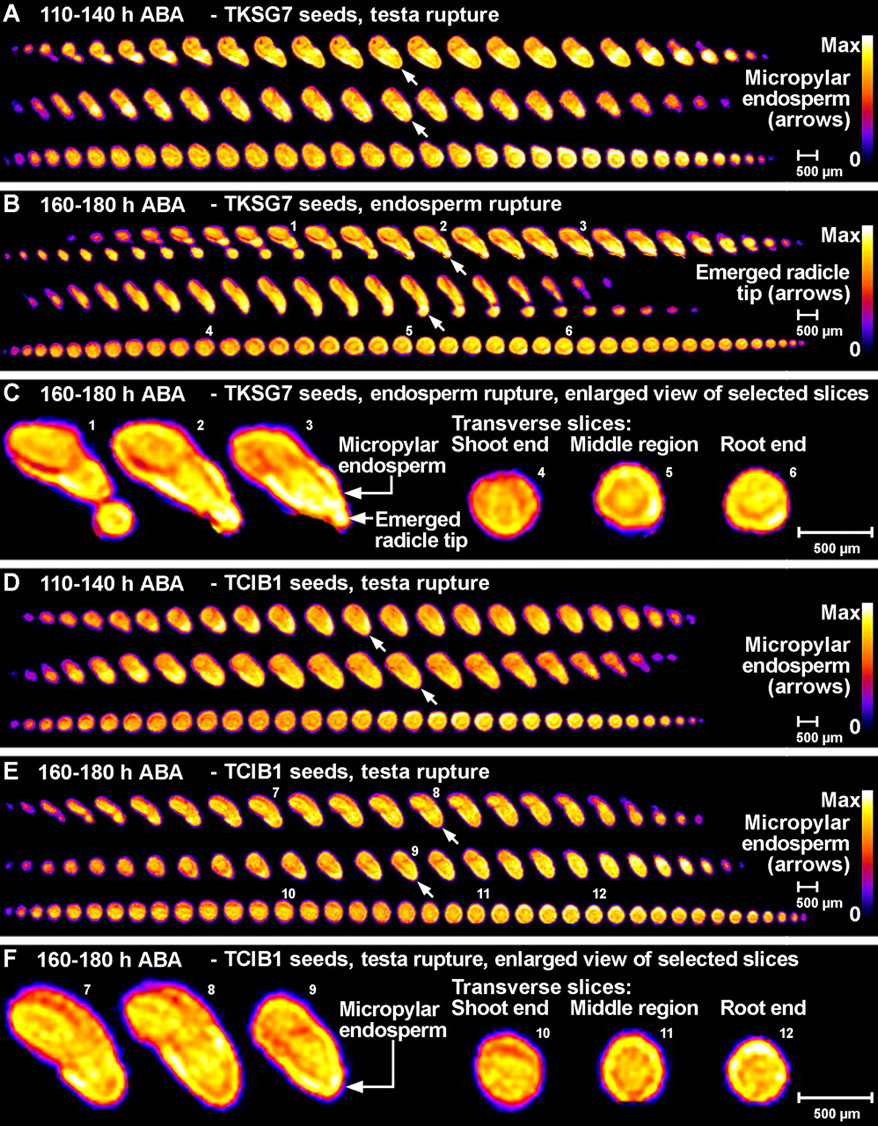
Figure 7. Noninvasive in vivo MRM microimaging analyses of the effect of Glu I overexpression on water uptake and distribution during tobacco seed germination in medium with 10 µM ABA. The spatial distribution of water within the seed tissues is visualized by false colors (relative scales from zero [0, black] to maximum signal strength [max, white]). A scale bar is given as a size marker. The NMR microimages were obtained with approximately 30 µm resolution. A, B, D, and E, Each of the sections shows 2D slices from full 3D NMR microimages as serial sections through three single seeds (one per row) at the given stage that corresponds to a time window presented in Figure 6A as gray box (110–140 h and 160–180 h, as indicated). Top two rows of each section: The serial microimages correspond to longitudinal sections with the orientation; radicle at the bottom, shoot at the top. Bottom row of each section: The serial microimages correspond more or less to transverse sections. A to C, TKSG7 (ßGlu I overexpressing) seeds. D to F, TCIB1 (empty-vector control) seeds. Small white arrows indicate the micropylar endosperm (A, D, and E) or the emerged root tip (B). C and F, Enlarged view of selected NMR microimages of TKSG7 (C) and TCIB1 (F) corresponding to slices presented in B and E, respectively. The small numbers designate the corresponding slices. Note: Corresponding 80 to 110 h results are presented in Supplemental Figure 1.
| Article in PDF format (852 KB) |
|
|
|
The Seed Biology Place
|
Webdesign Gerhard Leubner 2000
|