Plant Physiology 150: 1855-1865 (2009)
In vivo cell wall loosening by hydroxyl radicals during cress (Lepidium sativum L.) seed germination and elongation growth [W][OA]
The Edingburgh Cell Wall Group, Institute of Molecular Plant Sciences, The University of Edinburgh, The King's Buildings, Mayfield Road, Edinburgh EH9 3JH, United Kingdom (R.A.M.V., S.C.F.)
Commissariat à l'Energie Atomique (CEA), iBiTecS, CNRS URA 2096, Service de Bioénergétique, Biologie Structurale et Mécanisme, 91191 Gif-sur-Yvette Cedex, France (A.K.-L.)
Received April 9, 2009; accepted May 29, 2009; published June 3, 2009
www.plantphysiol.org/cgi/doi/10.1104/pp.109.139204
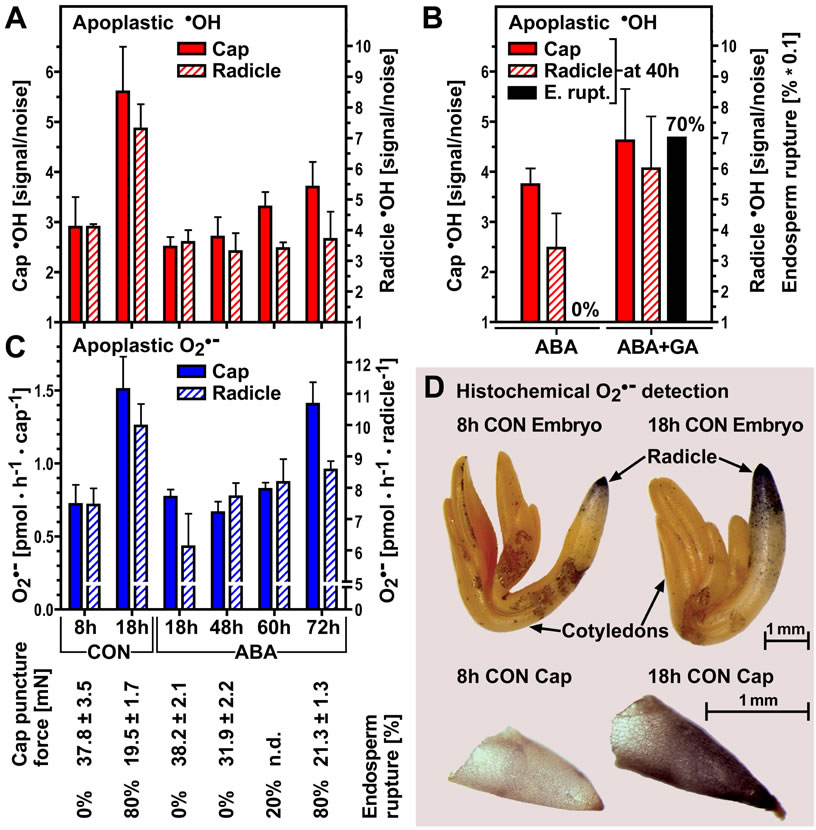
Figure 2. In vivo detection of apoplastic •OH and O2•¯production in cress caps and radicles during seed germination. (A) Quantification of EPR signal sizes indicative of in vivo generated apoplastic •OH in caps and radicles dissected at the times indicated. Seeds were incubated in medium without (CON) or with 10 µM ABA (ABA) added. Note the different scales of the Y-axes for cap and radicle. For comparison to the germination response, the puncture force and endosperm rupture values are given below graph D. (B) ABA-GA antagonism: In vivo generated apoplastic •OH (EPR as in A) in caps and radicles treated with ABA or ABA+GA (5 µM ABA, 10 µM GA4+7). Means of radicle samples (ABA vs. ABA + GA) differ significantly (P<0.05) as calculated by one way ANOVA followed by Tukey’s multiple comparison test (GraphPad Prism software). (C) Quantification of apoplastic O2•¯in intact caps and radicles by photometric determination of the reduction of XTT. (D) Histochemical staining of O2•¯production with NBT in embryos (10 min staining) and endosperm caps (15 min staining). (A-C) Mean values +/- SE of at least four replicates of 100 radicles and caps, respectively, are shown.
| Article in PDF format (1.7 MB) |
|
|
|
The Seed Biology Place |
Webdesign Gerhard Leubner 2000 |